Introduction
Biodiversity loss is one of our time’s most urgent environmental crises. Companies and organizations have a large responsibility in this ongoing crisis both as a contributor as well as by finding ways to alleviate pressure and find biodiversity-respectful solutions. We as researchers in the BIODIFUL project are striving to reduce the pressure on biodiversity through leadership and one of our tasks is to find ways in which to accurately measure biodiversity impacts to map current problem areas and give guidance to biodiversity-positive action. And what could be a better way to show leadership by measuring our own biodiversity impact to find means to reduce this pressure that we cause as a consortium. Here we guide you through the method we used, the results we found, and, of course, the measures we can take to reduce own biodiversity footprint!
How to measure BIODIFUL’s biodiversity impact?
While measuring the biodiversity impacts of a company or organization is luckily getting more interest, the impact of a consortium has never been calculated and therefore brought about some challenges. Luckily, at LUT university, we have an experienced team who has calculated biodiversity impacts of products as well as organizations. For example, recently, the biodiversity impacts of Lahti were calculated using the life cycle assessment (LCA) approach. Also to calculate the biodiversity impact of BIODIFUL, Anh Hoang, our master student at LUT university, applied LCA.
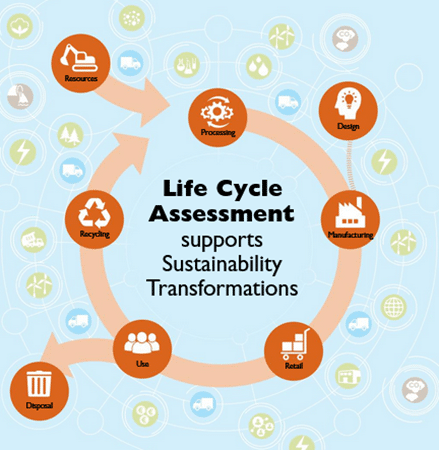
In LCA, the idea is to measure environmental impacts, in this case biodiversity impacts, from ‘cradle-to-grave’ – what this means is that all the required inputs (say raw materials such as metals used to make laptops that are used to do research) and output (such as greenhouse gas (GHG) emissions from flights to conferences or land needed to grow coffee beans) are collected for each step in the life cycle of a product. Inputs and outputs that come and go to the environment are called environmental flows and each of these flows contribute to a life cycle impact category. For example, GHG emissions are summed together and represent the contribution to climate change, while all land is lumped under ‘land use’.
Biodiversity impacts are measured by quantifying these impact categories, also known as biodiversity loss drivers, into a single unit that reflects the damage done to ecosystems. This single unit is called ‘potentially disappeared fraction of species’ and is shortly called PDF and reflects the fraction of species that would go extinct because of a pressure we cause to the ecosystem. For example, by releasing GHG emissions to the atmosphere the global average temperature goes up. Not all species can adjust to these temperature rise and thus run the risk of disappearing altogether. When we look at land use, species are under threat because we convert natural areas into human-managed land, such as cropland or cities. These human-managed areas are not so great in supporting a range of diverse species which means that wildlife has less space which potentially results in the loss of some species that cannot find a home to support themselves anymore. Water use, for example, for irrigation purposes on agricultural land can be considered a form of ‘land use’ within freshwater ecosystems as it reduces the volume of water (and thus habitat) available for freshwater species.
Climate change, land use, and water use were all considered into the biodiversity assessment of the BIODIFUL consortium.
To calculate the biodiversity impacts of BIODIFUL, Anh Hoang developed a biodiversity protocol for the consortium that was adapted from the Greenhouse Gas Protocol used in carbon footprinting to ensure that all relevant impact sources were considered. The goal of the protocol is to determine which environmental flows can be attributed to the BIODIFUL consortium either directly or indirectly. There are three, so-called scopes considered in the protocol:
- Scope 1: Direct impacts caused by an organization/company (such as manufacturing emissions). As a consortium we did not have any of these.
- Scope 2: Indirect impacts all normally include the energy sector but here we looked at purchased food because energy was not relevant for a consortium while food purchases potentially have a large impact. Food purchases included coffee/tea provided by the universities during coffee breaks as well as any food and beverage purchased by the consortium during joint meetings.
- Scope 3: All other impacts across supply chains. These include all indirect impacts and in carbon footprinting often account for the largest category for companies. Activities that are considered here are travel for research purposes (e.g. conference),
To estimate the biodiversity impact of BIODIFUL we gathered all financial data of each of the partners (Jyväskylä University, LUT, Turku University, and LUKE) and connected these to the EXIOBASE database. EXIOBASE combines economic data (in monetary terms) with environmental flows and could thus be used to quantify all GHG emissions, land use and water requirements for all the identified consortium activities under scope 1-3. Anh used the LC-IMPACT life cycle impact assessment methods to translate land use and GHG emissions, and water flows and GHG emissions into biodiversity impacts on the terrestrial ecosystem and freshwater ecosystem, respectively. All impacts were eventually calculated over the first 3 years of the consortiums.

What we found
Biodiversity impacts on terrestrial ecosystem were 2.44E-10 PDF·year while freshwater ecosystem had an impact of 8.40E-11 PDF·year, meaning that 0.0000000244% of all terrestrial ecosystem species and 0.0000000084% if freshwater species can potentially go extinct due to the 3-year activities of BIODIFUL. While these numbers sound very small, it is important to remember that there are an estimated 9 million species or even more (eukaryotes, thus species whose cells contain a nucleus, such as plants, animals, and fungi but not bacteria) on Earth.
Major contributors that led to these impacts were food purchases (accounting for 36% of terrestrial and 32% of freshwater impacts) and personal vehicle use when driving to BIODIFUL related activities (23% of terrestrial impacts).

When we scale the biodiversity impacts with the money spent within a category, we can identify several that had a relatively high contribution. For example, while only about 8% of the money went to daily allowance (which was assumed to be used for food purchases), most of the impacts were attributed to it and a similar trend was visible for groceries and beverages. This is because agricultural products tend to have a higher overall biodiversity impact linked to land use requirements, irrigation needs, and GHG emissions; the agricultural sector occupies about 50% of all habitable land, is responsible for 70% of freshwater subtraction, and about one third of global emissions can be linked to the food sector (Campbell et al. 2017; Ritchie and Roser 2019; Crippa et al. 2021).

Although almost all the BIODIFUL activities took place in Finland (with the exception of conference visitations abroad), biodiversity impacts were not limited to Finland itself due to global supply chains; only 47% of terrestrial impact occurred within Finland and only 28% of the freshwater impact, highlighting that while purchases were made locally, their impacts are spread across the globe.
Mitigation strategies
Measuring one’s impact is useful only when it leads to changes in one’s behavior that reduce the loss of biodiversity. Based on the found results, a list of mitigation strategies were recognized.
- Shift to plant-based diets: Vegan meals reduced the BD impacts by 65 – 79% compared to meat-based options (Veerappa et al., 2023). The researchers at the consortium already prefer vegan diets (64%), though further improvements are possible.
- Cut personal vehicle use: Transition to public transport, biking, or carpooling to reduce fossil fuel reliance. Alternatively, electric personal vehicles can be considered.
- Promote remote work: Hybrid models minimize office space needs and commuting. However, explicit studies on the impacts of home-office on biodiversity are needed to precisely capture the effect, reallocating the impacts between the organization’s behalf and personal responsibility.
- Host virtual conferences: This could be implemented as an extension of promoting remote work. Virtual conference reduces accommodation and travel demands while maintaining collaboration.
- Regular monitoring: Annual or biannual BD footprints assessments help track progress and identify new hotspots.
We recommend anyone interested in further results of the assumptions behind the model to go and read the thesis by Anh Hoang.
References
Campbell BM, Beare DJ, Bennett EM, et al (2017) Agriculture production as a major driver of the earth system exceeding planetary boundaries. Ecology and Society 22:. https://doi.org/10.5751/ES-09595-220408
Crippa M, Solazzo E, Guizzardi D, et al (2021) Food systems are responsible for a third of global anthropogenic GHG emissions. Nat Food 2:198–209. https://doi.org/10.1038/s43016-021-00225-9
Ritchie H, Roser M (2019) Half of the world’s habitbale land is used for agriculture. In: OurWorldinData.org. https://ourworldindata.org/global-land-for-agriculture#licence. Accessed 10 Sep 2021
Veerappa, M.M., Uusitalo, V., and Järviö, N. (2023) Biodiversity impact assessment of different meal options based on Life Cycle Assessment (LCA). Master’s Thesis, LUT University.